Ontologic.
Ontologic is a data management and analysis platform that enables its users to process and analyze their data using the platform's services. Challenge: To create an accessible user experience for current and prospective customers.
Project Overview
Competitive & Comparative Feature Analysis
To start, I created a Competitive and Comparator Analysis that compares features from 4 direct competitors. However, due to limitations in Ontologic's current platform, it falls behind its competitors.
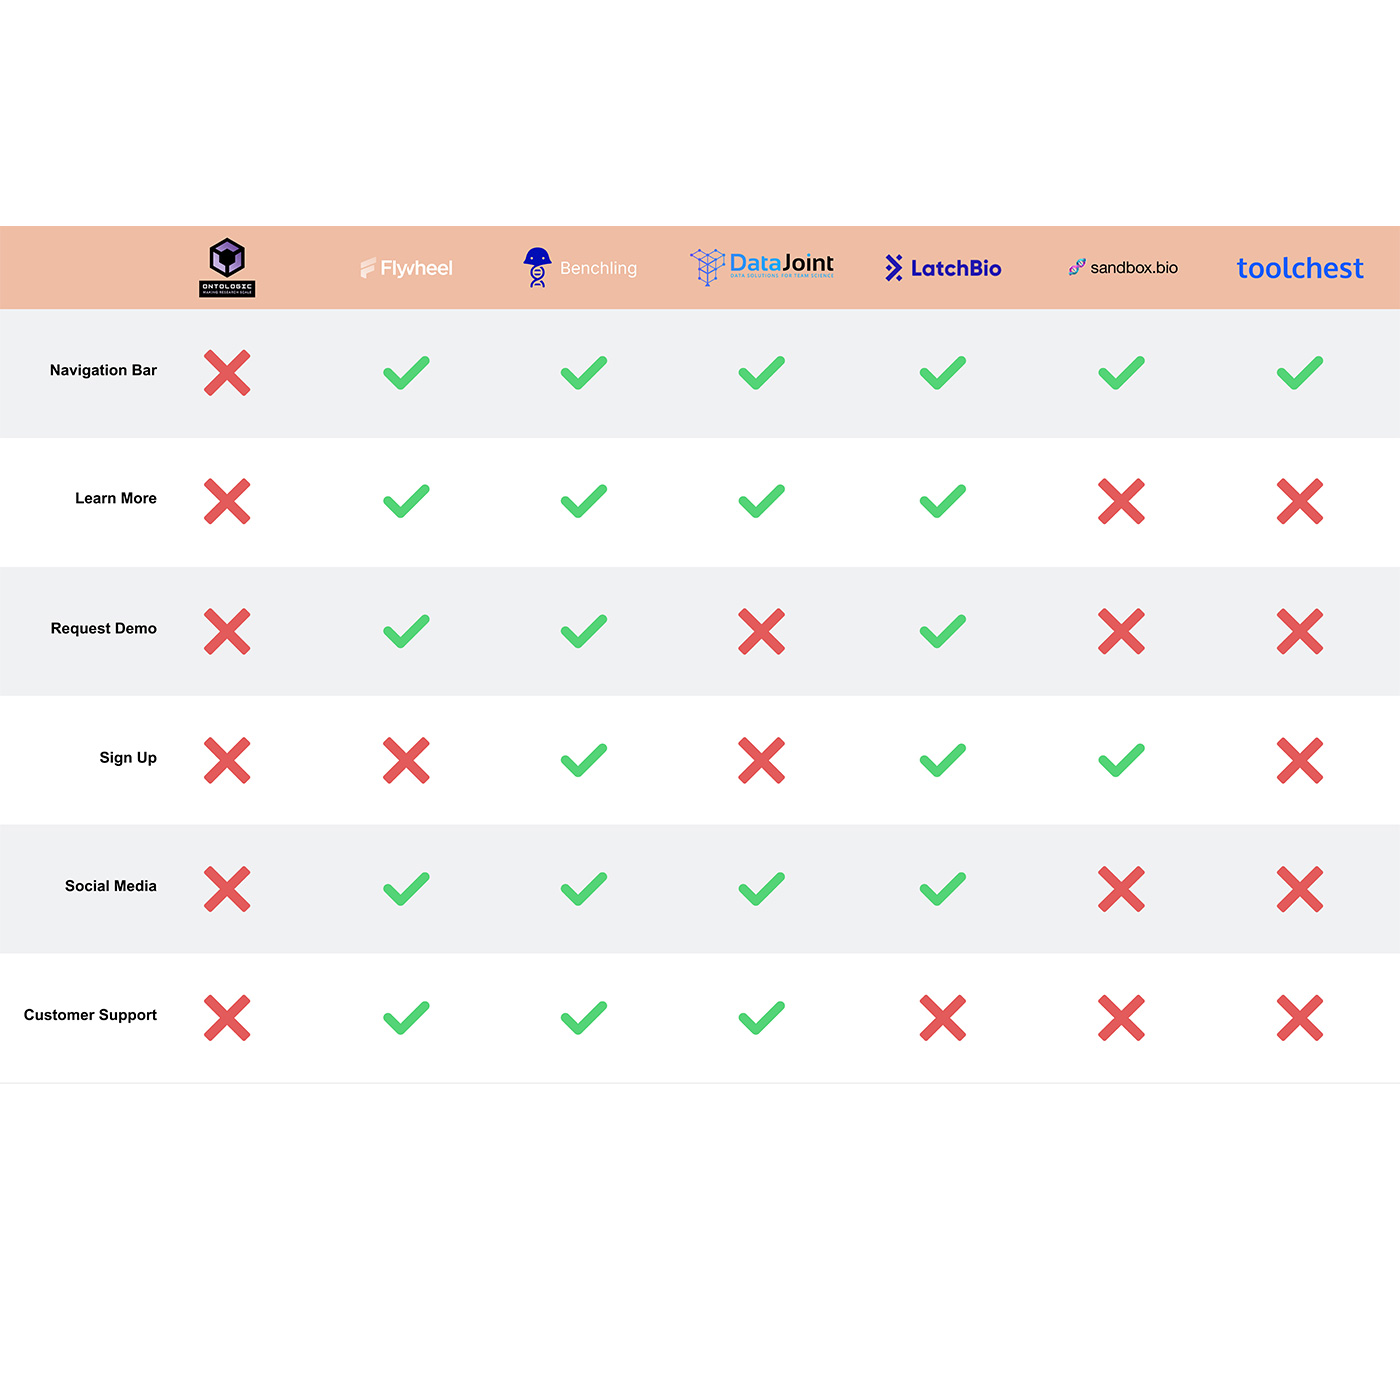
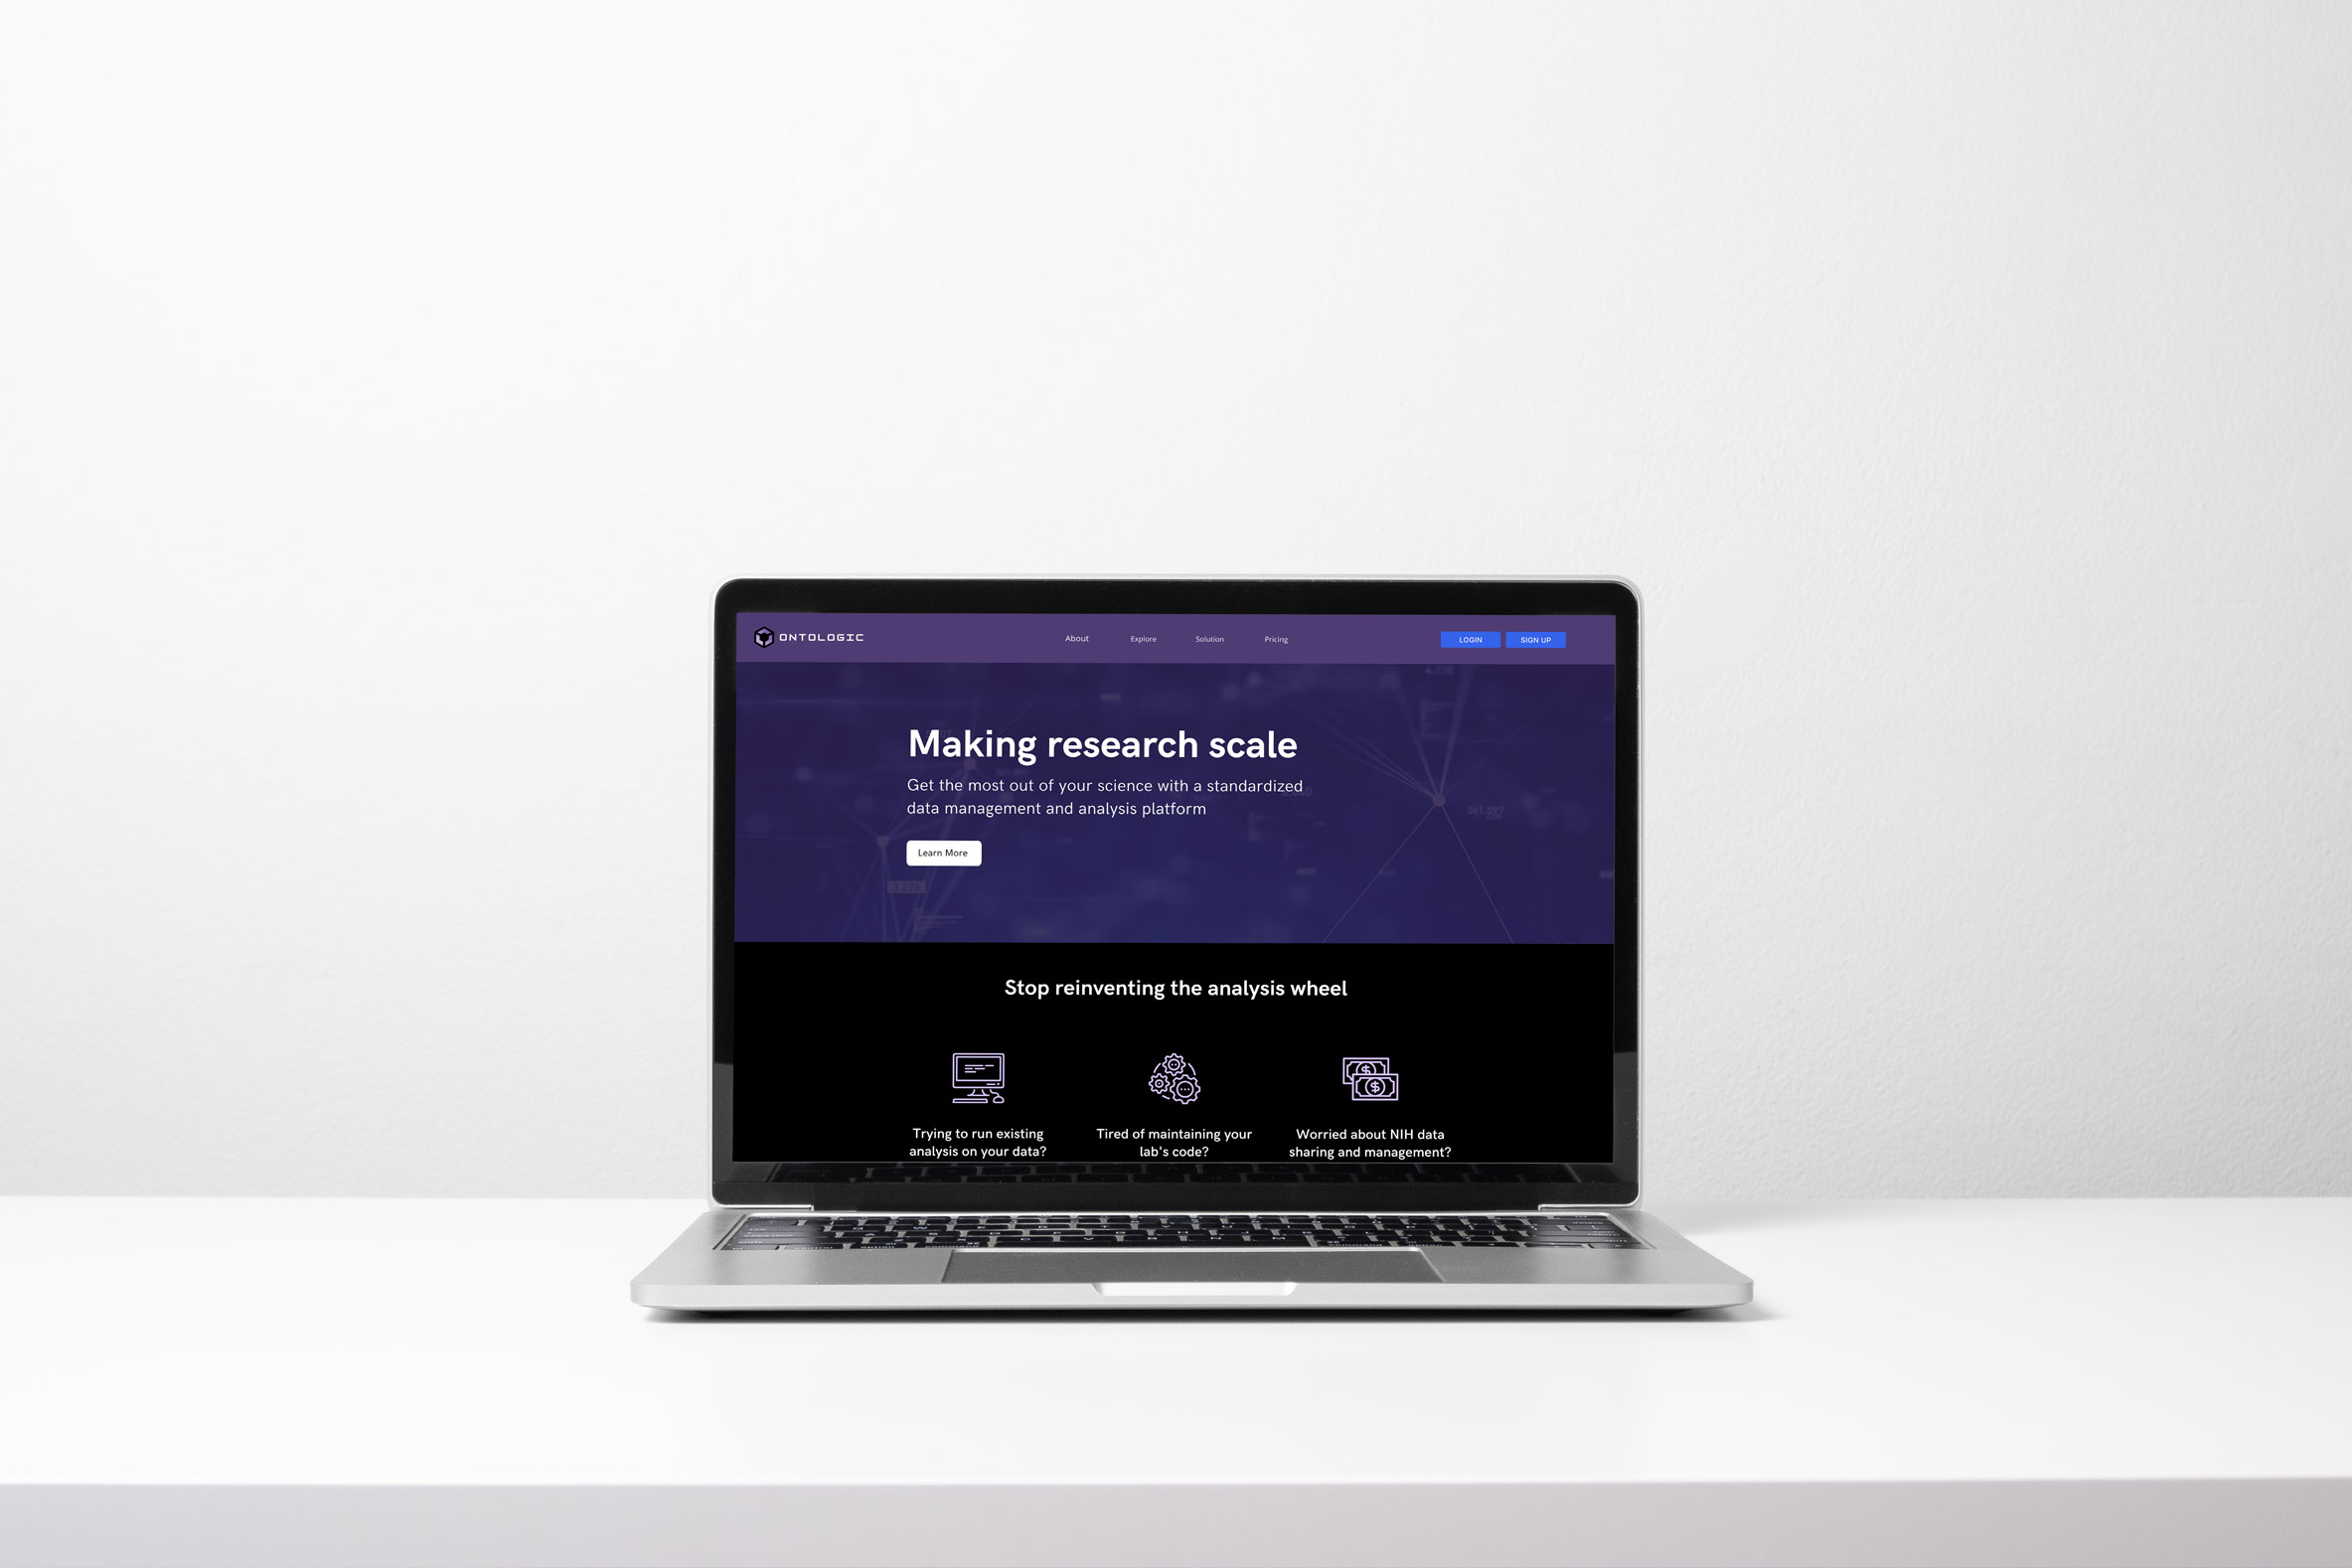
Fortunately, this presented an opportunity to create new features such as a navigation bar, complete with a Login/Sign up button and a way to access the service. I will expand on this as we move forward.
User Interviews & Opportunities
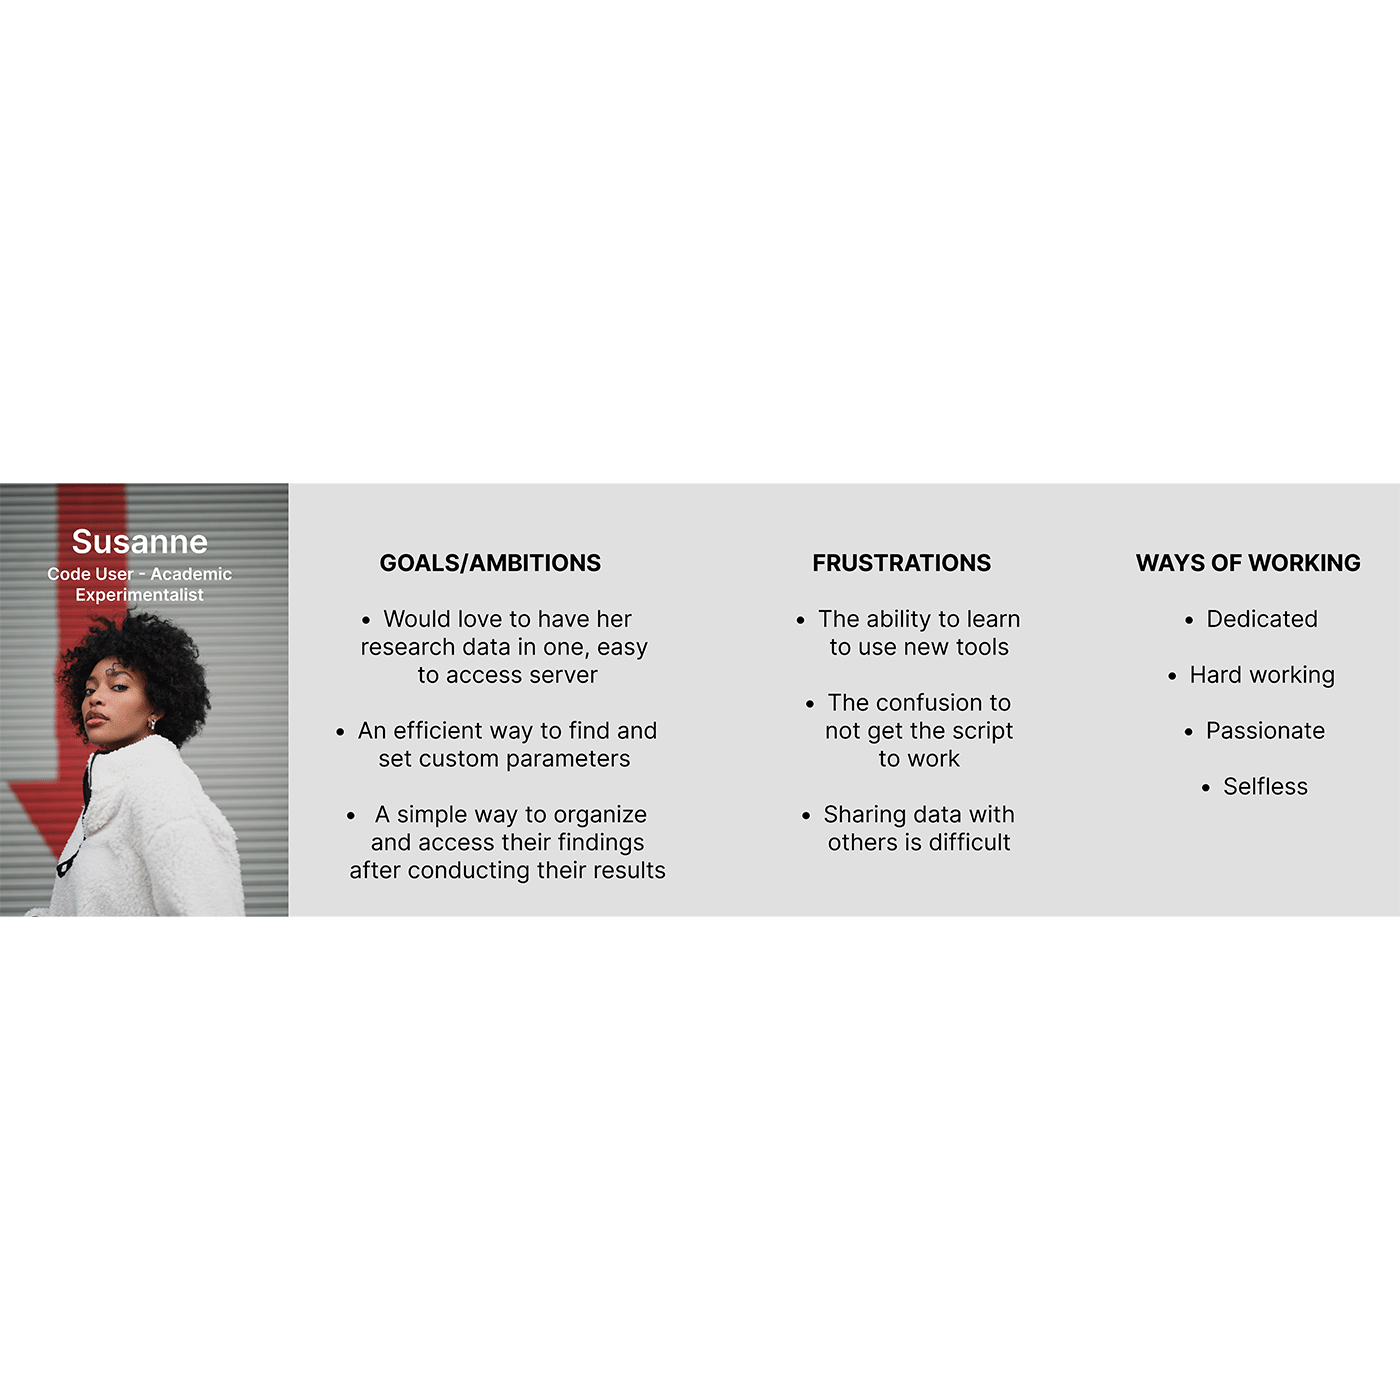
Meet Susanne!
Susanne is an amalgamation from our research, and is an interpretation of a prospective user.
- Susanne is a PHD graduate who specializes in experimental neurophysiology.
- During her research, she found herself requiring a script that a colleague developed.
- She is in need of a service that can provide access to a script library and analyze her data.
To provide a deeper understanding of her experience on the website, I will now guide you through the steps from start to finish.
Mapping Susanne's Journey
I wanted to depict Susanne's thought process and emotions as she navigates through the website to achieve her goal. Her scenario is this: As Susanne has previously run several experiments and has a large amount of data to analyze. She wants to log in to the Ontologic website, upload her scripts, and set the parameters. To understand her experience and how her mood changes throughout the scenario, I have divided her journey into five phases.
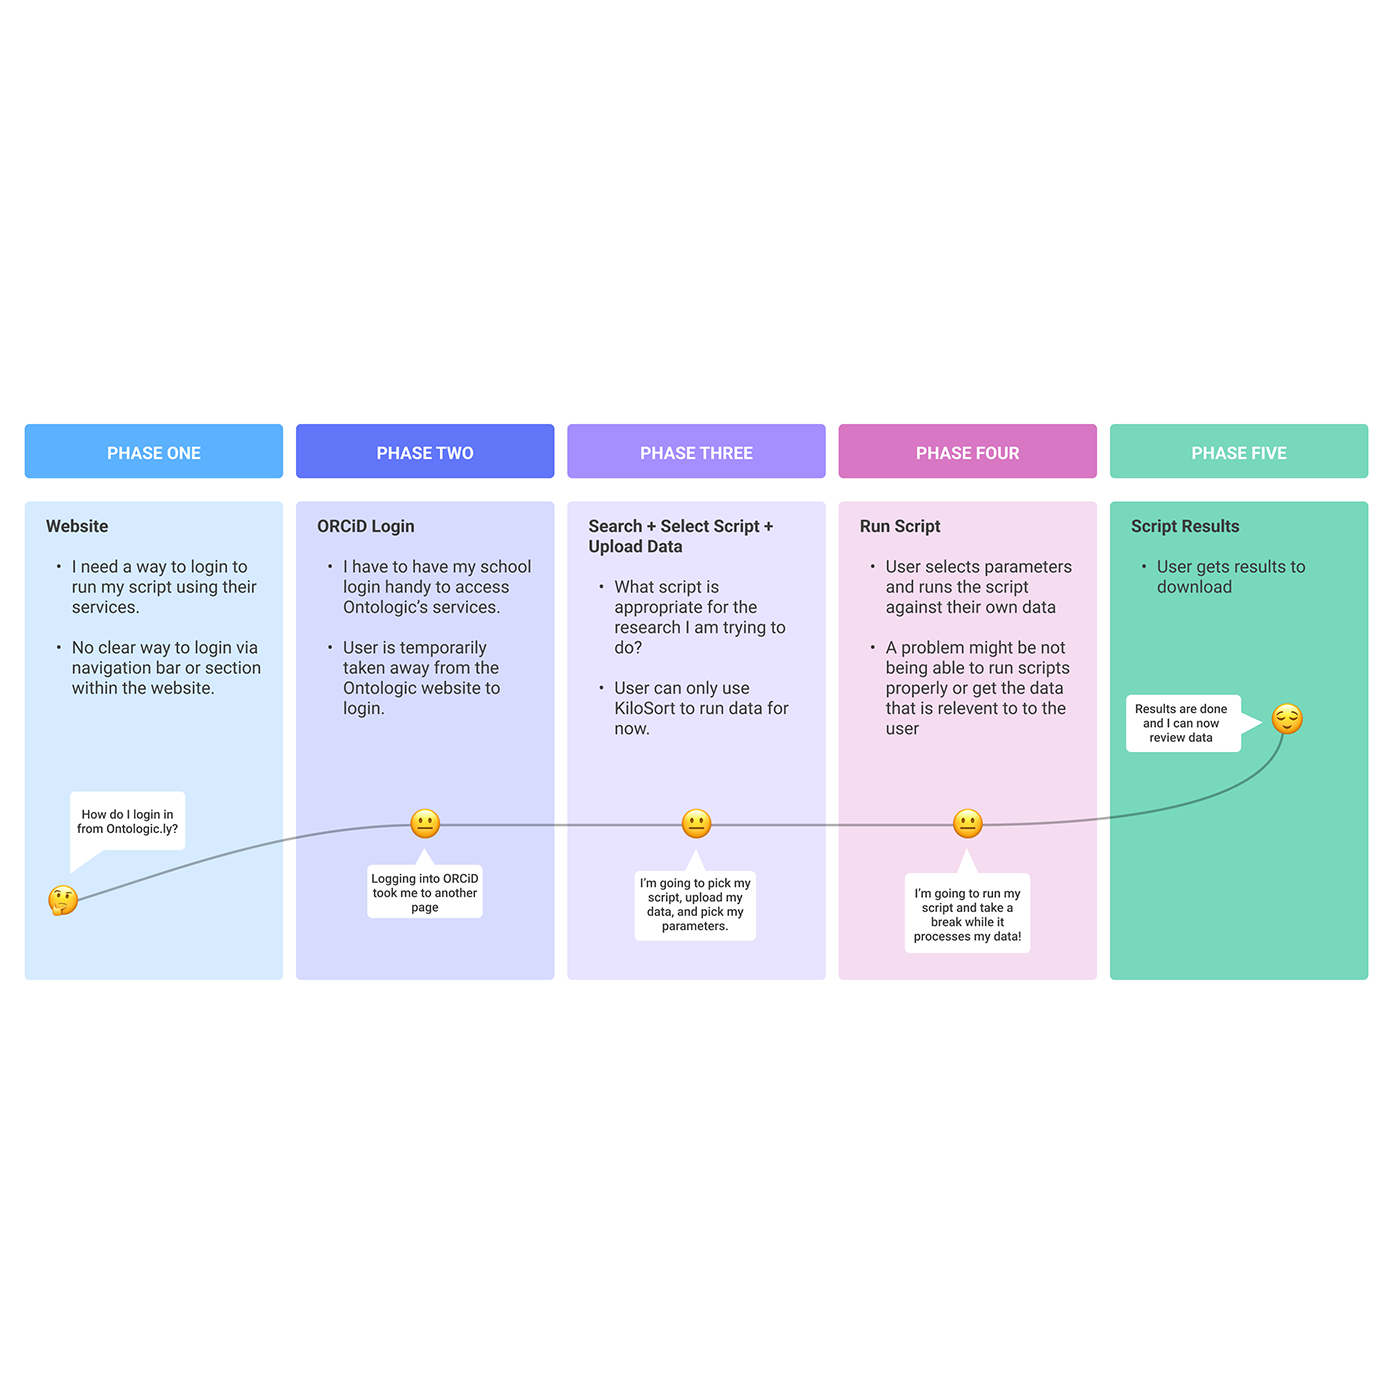
Phase 1: Susanne is confused as there is no current way to log in to the service. Opportunity: We can redesign the navigation bar to make the "Login" button more prominent. Placing the button in other areas of the site is also recommended. Phase 2: Susanne is provided with a link and directed to the ORCiD login page. After successfully logging in, she is taken to the dashboard. She is slightly confused as to why she was taken out of the Ontologic experience, but continues with the process. Opportunity: We recommend creating our own login page with credentials. A consultation with developers is recommended. Phase 3: Susanne calmly searches for her script and selects the version she needs. She now has the ability to upload her data for synthesis. After that, she sets the parameters and is now ready to run her data. Opportunity: Ensuring that the scripts are easy to understand so that anyone can easily find and select the script they need. Phase 4: Susanne proceeds with the process of running her script. She selects "Run Kilosort" and takes a break while the data is being analyzed. Opportunity: We recommend conducting A/B testing to ensure that users can easily upload and use the service as intended. Phase 5: Her results are ready! She automatically receives a download to her computer and can review her data. She is pleased that there were no errors and can begin analyzing her results. Opportunity: Advise providing alternative formats for downloading the results within the script.
MVP (Minimal Viable Product)
Designing an Experience
Now that we have the basic components and functions of our service established, we chose to create a low-to-medium-fidelity wireframe.
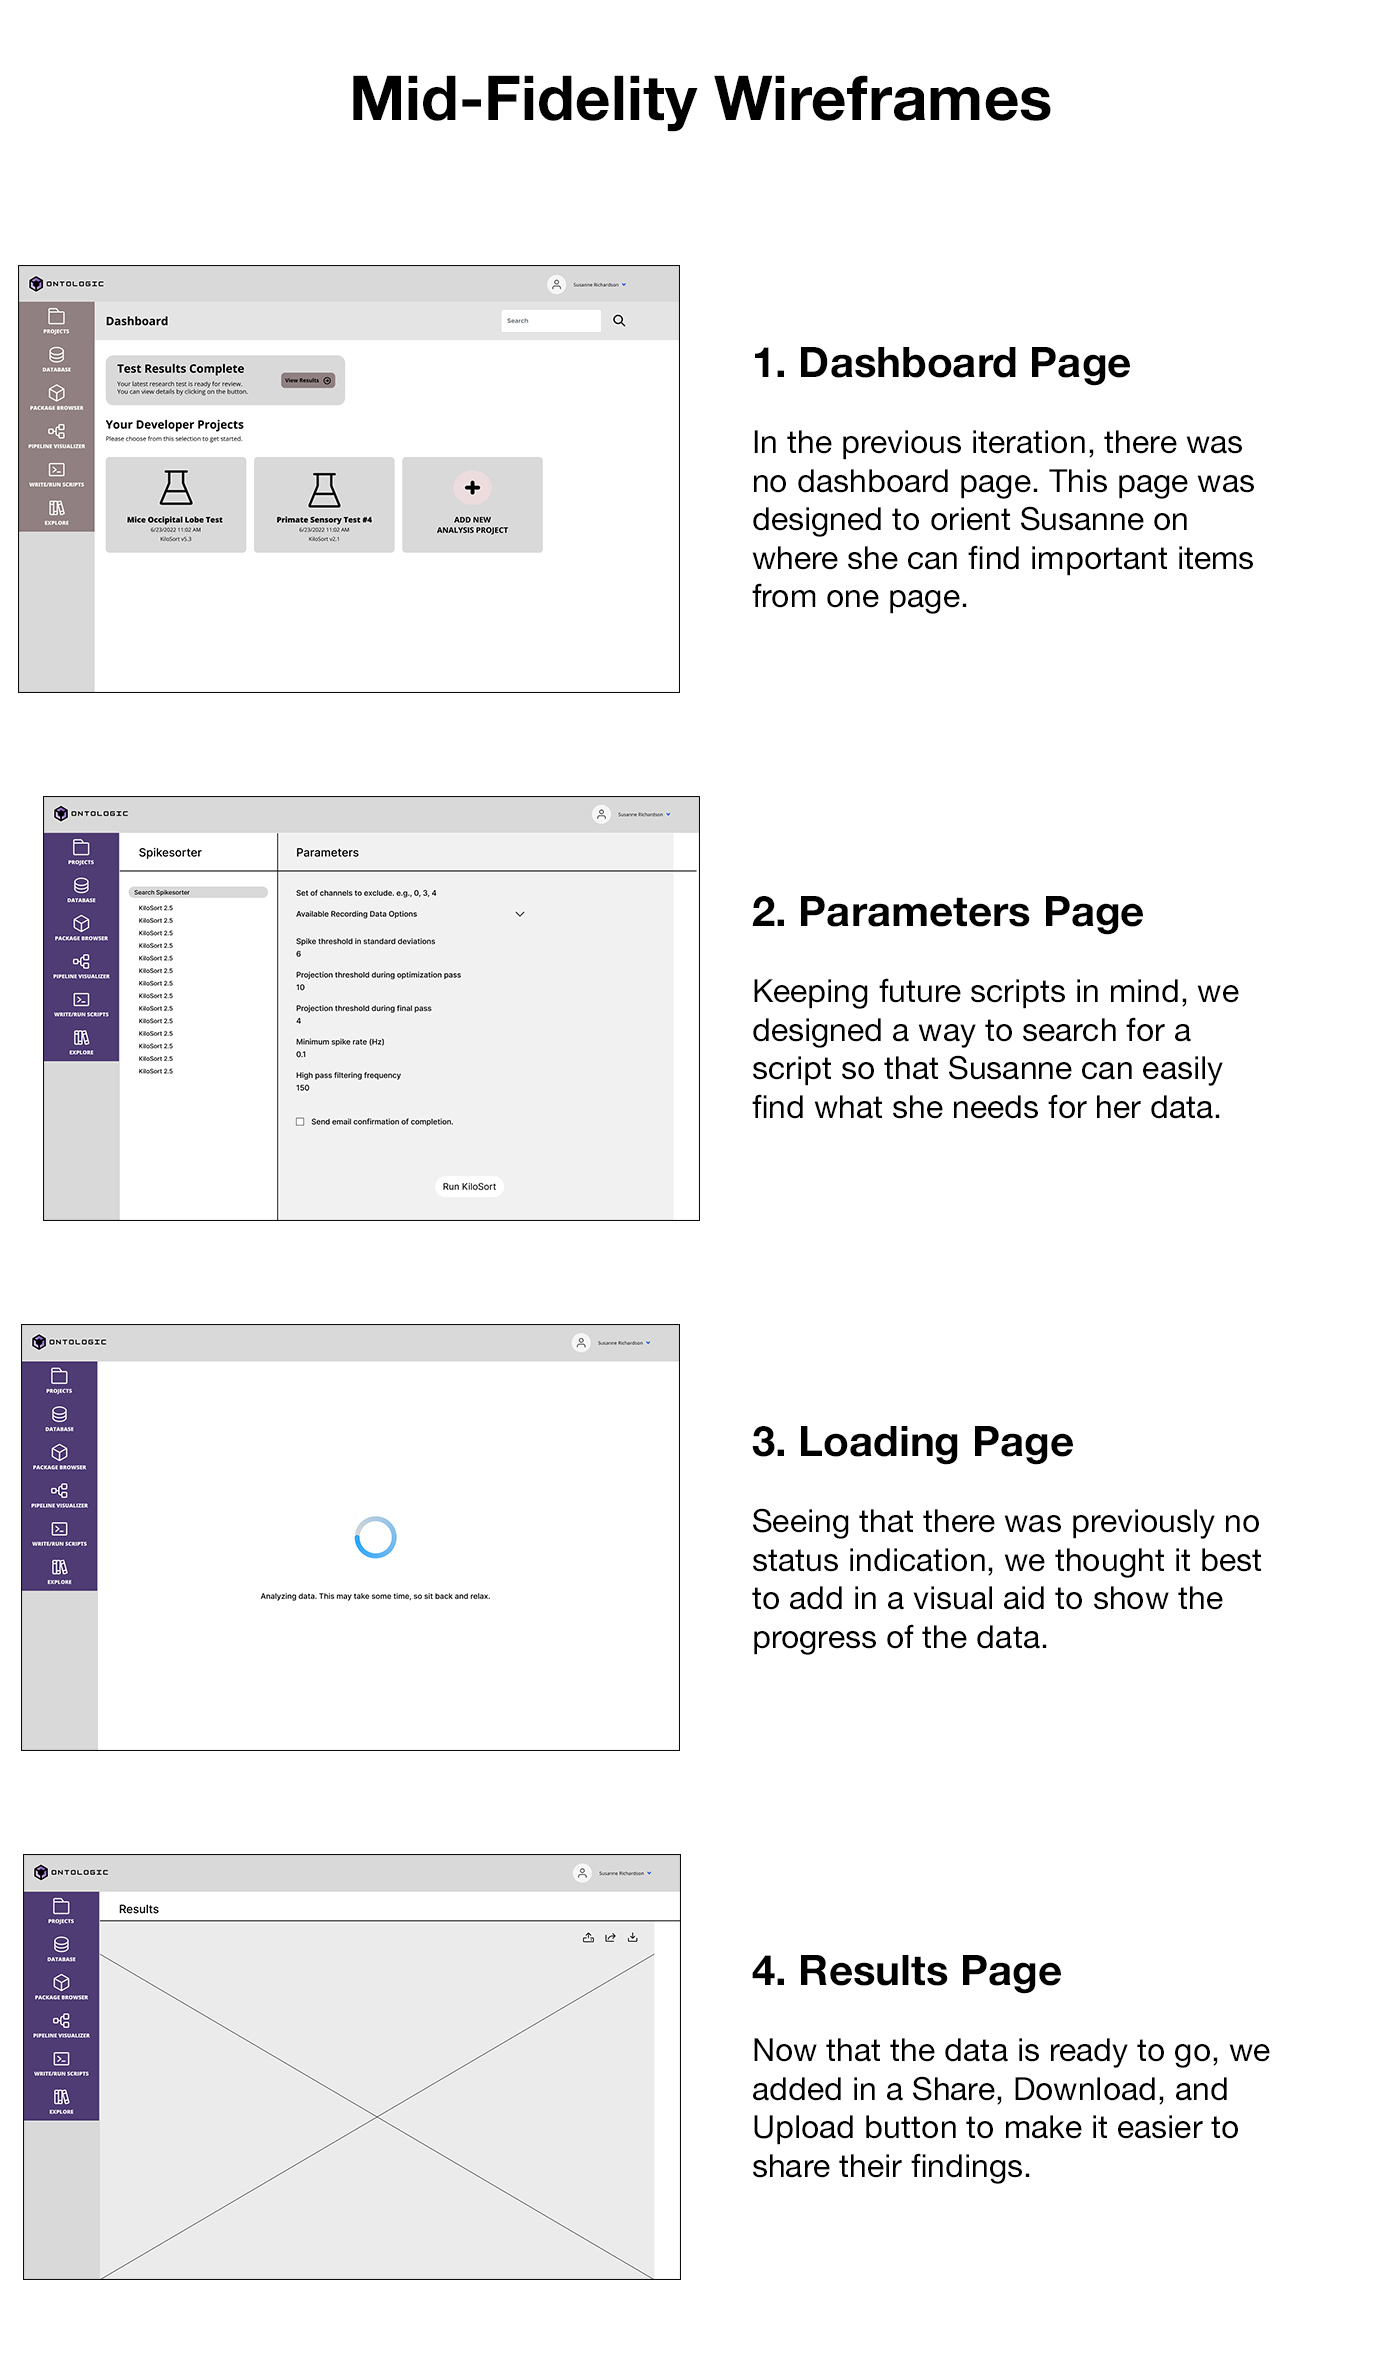
Now that we have this wireframe, the next step is to test and evaluate if our product is meeting the needs of users like Susanne.
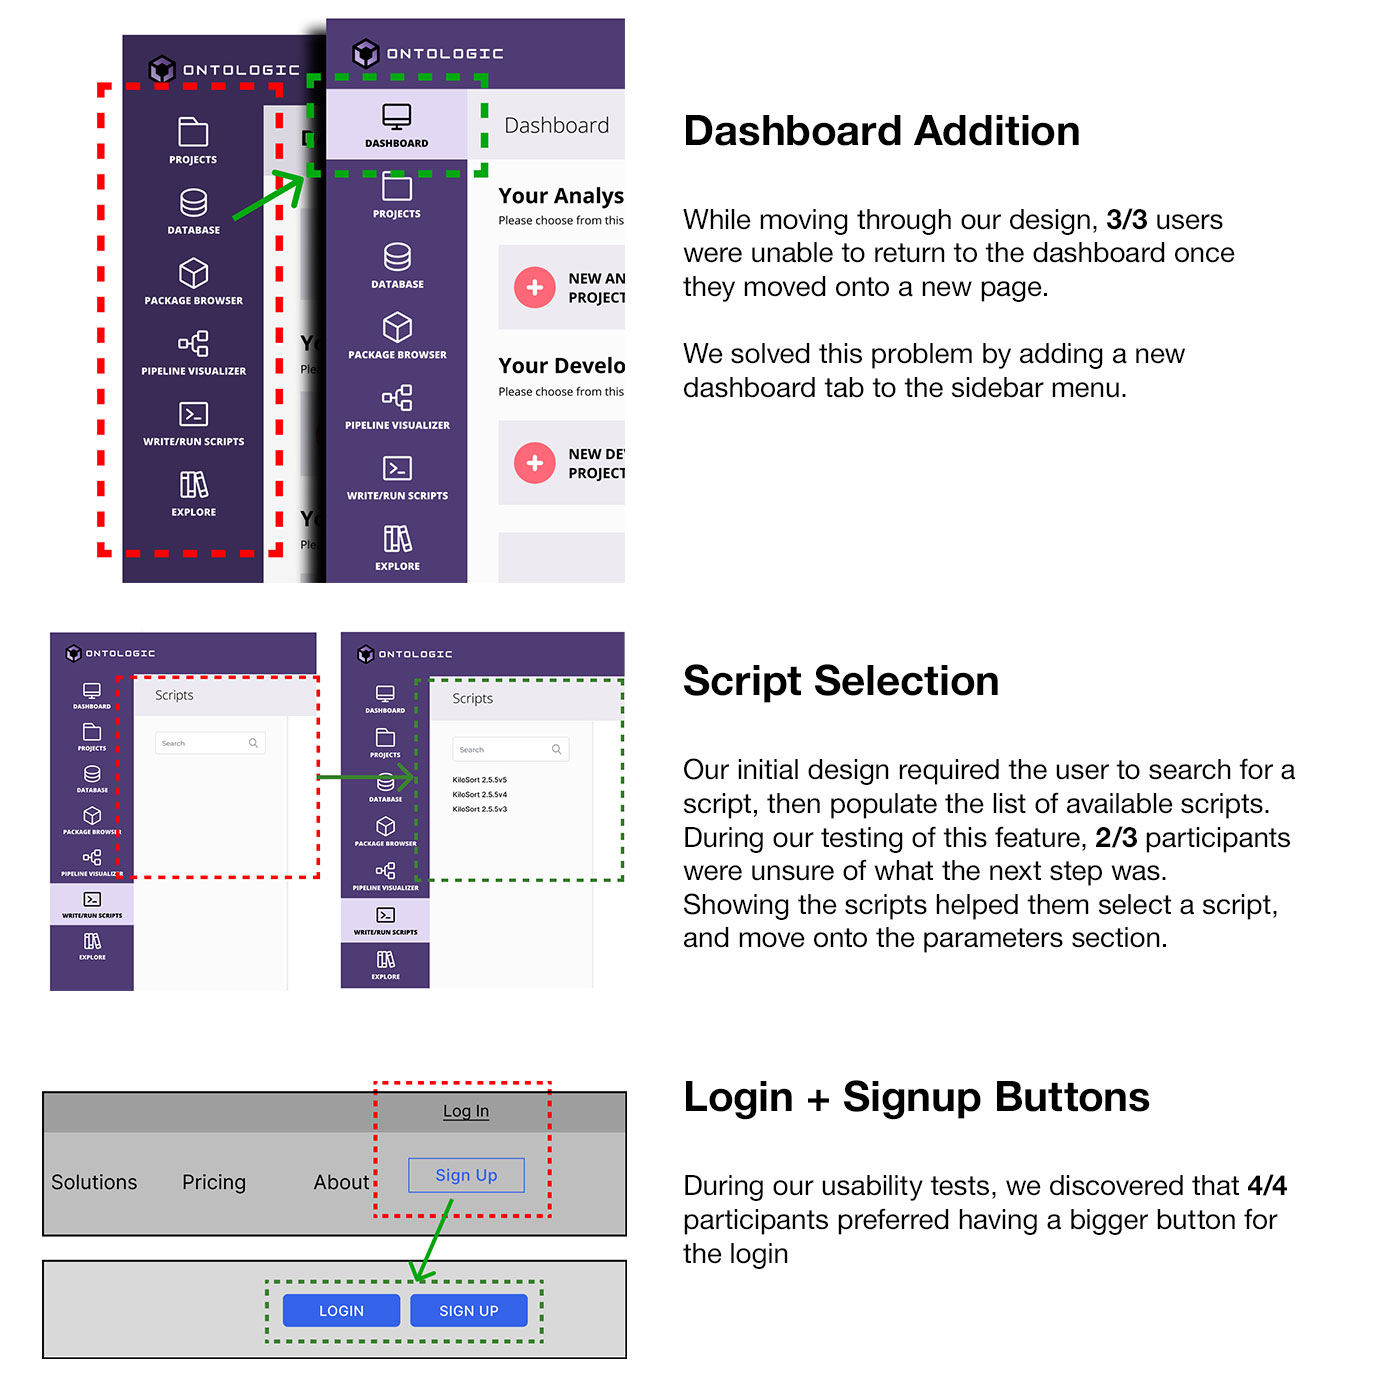
Usability Testing
We have a motto in our industry; test early and test often. Keeping this in mind, we conducted a Usability Test to evaluate specific functions and gauge user reactions. During the test, we observed the following notable issues:
Through countless iterations, we refined our design until it was ready to be tested as a high fidelity prototype.